Timing Helper
This snippet of code is very simple, but very powerful.
Wrapping a block of code with this method will allow you to track how much time it takes to run
  def _t(label)
    t = Process.clock_gettime(Process::CLOCK_MONOTONIC)
    ret = yield
    puts "#{label} #{Process.clock_gettime(Process::CLOCK_MONOTONIC) - t}"
    ret
  end
Example Code
  i = 0

  # This will output a basic statement
  _t('basic') do
    puts i
  end

  # This will output a basic statement
  _t('longer') do
    while i < 30
      i += 1
      sleep 0.1
    end
  end

  # _t('method') is called many times because of the recursion
  # In this case we will see many outputs for _t('method')
  # This may not be what we want, see the aggregation demo
  def my_method(i = 0)
    _t('method') do
      return if i > 20
      sleep 0.1
      my_method(i + 1)
    end
  end

  my_method
Output
  0
  basic 3.700001980178058e-05
  longer 3.099142999999458
  method 0.1033249999745749
  method 0.20763499999884516
  method 0.31305300001986325
  method 0.41850800000247546
  method 0.5237309999938589
  method 0.629190000006929
  method 0.734292999986792
  method 0.8383620000095107
  method 0.938666000001831
  method 1.0441250000149012
  method 1.1493350000237115
  method 1.2505610000225715
  method 1.3516309999977238
  method 1.4528080000018235
  method 1.5531109999865294
  method 1.6536609999893699
  method 1.757898000010755
  method 1.8631080000195652
  method 1.9683300000033341
  method 2.073551999987103
  method 2.1743229999847244
  => nil
Aggregate Helper
The timing code was simple and powerful, but it didn't quite work if a line or block was called many times.
To solve this, I used a global variable to keep track of how long and how many times each call is hit.
  $agg = {}
  at_exit do
    line_column_size = $agg.keys.max_by(&:size).size
    time_column_size = $agg.values.max_by { |v| v[:time].to_s.size }[:time].to_s.size

    puts "| line#{' ' * (line_column_size - 4)} | num_calls | time (s)#{' ' * (time_column_size - 8)} |"
    puts "| #{'-' * line_column_size} | --------- | #{'-' * time_column_size} |"
    $agg.each do |k, v|
      line_entry = k.tr('|', '')
      line_entry << ' ' * (line_column_size - line_entry.size)

      num_calls = v[:num_calls].to_s
      num_calls << ' ' * (9 - num_calls.size)

      time = v[:time].to_s
      time << ' ' * (time_column_size - time.size)

      puts "| #{line_entry} | #{num_calls} | #{time} |"
    end
  end

  # Aggregate the time it takes to run a block of code.
  # Returns the value of the block.
  # At exit, it will output the aggregated time.
  def _ta(label)
    $agg[label] ||= { time: 0, num_calls: 0 }
    t = Process.clock_gettime(Process::CLOCK_MONOTONIC)
    ret = yield
  ensure
    $agg[label][:time] += (Process.clock_gettime(Process::CLOCK_MONOTONIC) - t)
    $agg[label][:num_calls] += 1
    ret
  end
Example Code
  i = 0

  # This will react the same as _t
  # except the result is deferred to the end
  _ta('basic') do
    puts i
  end

  # This will react the same as _t
  # except the result is deferred to the end
  _ta('longer') do
    while i < 30
      i += 1
      sleep 0.1
    end
  end

  # _ta is called many times here
  # But because it is aggregated - we only see once at the end
  def my_method(i = 0)
    _ta('method') do
      return if i > 20
      sleep 0.1
      my_method(i + 1)
    end
  end

  my_method
Output
  0
  | line   | num_calls | time (s)              |
  | ------ | --------- | --------------------- |
  | basic  | 1         | 3.600001218728721e-05 |
  | longer | 1         | 3.0774530000053346    |
  | method | 22        | 23.5655019999831      |
  => nil
Gantt Charts
Aggregating the times was a great step to improve usability of the code.
But we can visualize the information to improve it even more. Gantt Charts are a common engineering tool that can help here.
This code outputs a syntax that can be consumed by my Chart Helpers Gem.
  require 'chart_helpers'
  require 'date'

  # We use a global aggregate cache to allow us to track methods within a loop all at once
  $timed = {}

  at_exit do
    $timed.each do |method_name, timed_hash|
      output = []

      # Output Chart Helpers syntax for gantt
      title_file = timed_hash[:path].dup
      title_file.gsub!(ENV.fetch('GEM_HOME', 'GEM_HOME'), '')
      title_file.gsub!(ENV.fetch('HOME', 'USER'), '')
      output << "gantt"
      output << "   title file: #{title_file} method: #{method_name}"

      curr_percent = 0.000

      # Aggregate the lines together. Loops can cause things to become unweildly otherwise
      @grouped_lines = timed_hash[:entries].group_by do |line|
        [line[:line], line[:line_no]]
      end

      # Calculate total time for all groups
      total_group_time = ->(group) do
        gantt_chart_time = 0.000024 * group.size # 0.000024 is an approximation
        time = group.collect { |e| e[:time] }.inject(:+) - gantt_chart_time
        time < 0.001 ? 0.001 : time
      end
      total_time = @grouped_lines.collect { |_, group| total_group_time.call(group) }.inject(:+)

      @grouped_lines.each do |(group_name, _line_no), group|
        # If we have run more than once, we should indicate how many times something is called
        entry_name = group.size > 1 ? "#{group_name} (run #{group.size} times)" : group_name
        entry_name = entry_name.tr('"', "'").tr(",", ' ') # Sometimes Chart Helpers has trouble with these

        # Total time for all entries to run
        time = total_group_time.call(group)
        percent = (time / total_time * 100)

        # Output the line
        post_percent = percent + curr_percent
        output << format("   \"%s\" :a1, %.3f, %.3f", entry_name, curr_percent, post_percent)
        curr_percent = post_percent
      end

      output << "\n\n"

      file_name = "output/#{method_name}.svg"
      puts "Outputting chart to #{file_name}"
      # Could also output the `output` content instead
      # The original intention of the library was to use
      # human readable/writeable syntax
      ChartHelpers.render_chart(output.join("\n"), file_name)
    end
  end

  def _gantt_chart
    ret = nil

    # Determine the method and path that we're calling from
    call_loc = caller_locations.reject { |l| l.path.include?('byebug') }.first
    method_name = call_loc.label
    path = call_loc.path
    source = File.readlines(path)

    unless $timed[method_name]
      puts "Tracing #{path} for method #{method_name}"
      $timed[method_name] = { path: path, entries: [], calls: 0 }
    end

    # This block will be used to finalize the time it to run, gather the line source, etc.
    finalize_time = -> () do
      if last = $timed[method_name][:entries].pop
        # Finalize the time
        return if last[:start].nil? # Sometimes at the end it can mess up
        time = Process.clock_gettime(Process::CLOCK_MONOTONIC) - last[:start]
        # Get the source line from the line number
        line = source[last[:line_no] - 1].strip
        next if line.include?('_gantt_chart')
        $timed[method_name][:entries] << { line_no: last[:line_no], line: line, time: time }
      end
    end

    # We use Ruby's tracepoint on a per line basis
    # We only care about lines called within our method and within our path
    trace = TracePoint.new(:line) do |tp|
      next unless tp.path == path
      next unless tp.method_id.to_s == method_name.to_s

      # We could have a call from last time, finalize it, we've moved to a new line
      finalize_time.call
      # Initialize a new entry with the line number and a start time
      $timed[method_name][:entries] << { line_no: tp.lineno, start: Process.clock_gettime(Process::CLOCK_MONOTONIC) }
    end

    begin
      trace.enable do
        ret = yield
      end
    ensure
      finalize_time.call # The last call needs to be finalized, finalize it here
    end

    ret
  end
Example Code
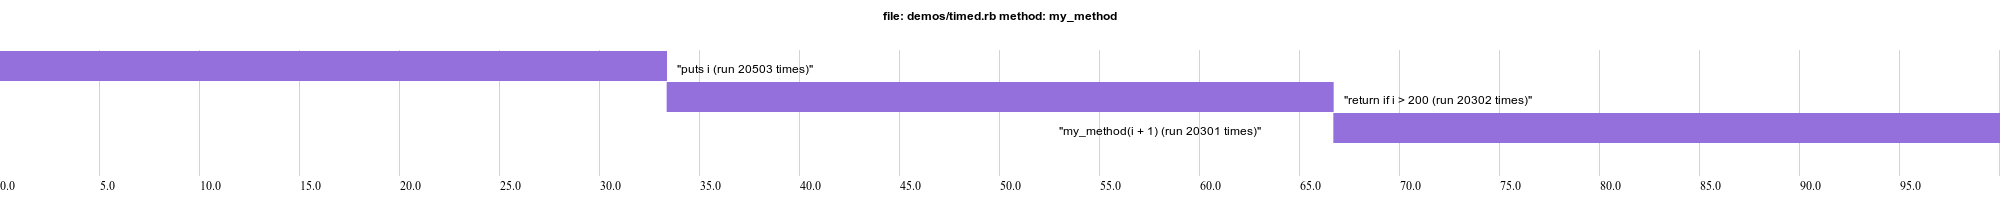
# This is the basic example of a gantt chart
# Each line takes about an equal amount of time
def my_method(i)
_gantt_chart do
puts i
return if i > 200
my_method(i + 1)
end
end
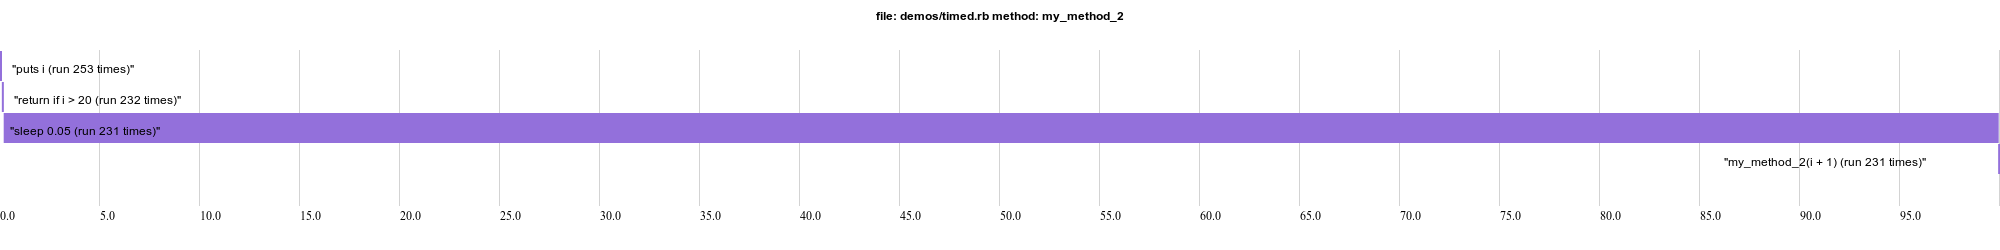
# This shows the difference when one line takes a lot longer than the others
# You can see the `sleep` line takes a lot longer than the other lines
def my_method_2(i)
_gantt_chart do
puts i
return if i > 20
sleep 0.1
my_method_2(i + 1)
end
end
my_method(0)
my_method_2(0)
Output
Put it all together
With all of these you can end up creating flow charts and gantt charts to determine slow paths in the code.